| Year | Losses | Civilian Injuries | EMS Runs | Fire Responses | Structure Fires | Residential Fires | Other Responses | Total Responses |
|---|---|---|---|---|---|---|---|---|
| 2014 | 10,620,223 | 24 | 30,731 | 1,224 | 819 | 672 | 8,423 | 40,378 |
| 2015 | 14,091,422 | 16 | 32,634 | 1,445 | 934 | 781 | 9,847 | 42,243 |
| 2016 | 6,955,523 | 16 | 34,618 | 1,387 | 908 | 758 | 10,732 | 45,083 |
| 2017 | 8,190,628 | 33 | 36,117 | 1,368 | 895 | 742 | 10,823 | 46,660 |
| 2018 | 7,973,608 | 34 | 37,120 | 1,449 | 963 | 799 | 10,736 | 47,464 |
| 2019 | 5,599,668 | 41 | 38,914 | 1,400 | 847 | 700 | 9,640 | 50,092 |
| 2020 | 99,876,241 | 33 | 39,593 | 1,755 | 1,009 | 799 | 10,459 | 50,317 |
| 2021 | 11,613,812 | 26 | 44,753 | 1,989 | 1,051 | 835 | 13,244 | 57,388 |
| 2022 | 10,973,065 | 42 | 46,770 | 1,927 | 1,083 | 847 | 12,900 | 60,265 |
| 2023 | 15,356,854 | 27 | 50,104 | 1,853 | 1,055 | 793 | 12,650 | 62,943 |
| 2024 | 11,739,136 | 32 | 50,436 | 1,792 | 1,064 | 841 | 13,603 | 65,711 |
*2020 includes property loss resulting from fires during civil unrest
63% increase in calls for service over the past 10 years.
The Department has experienced a 63% increase in calls for service over the past 10 years. The area of greatest growth has been EMS calls for service which increased by 64% during the same period. Total calls for service rose by over 4.4% in 2024 over the previous year.
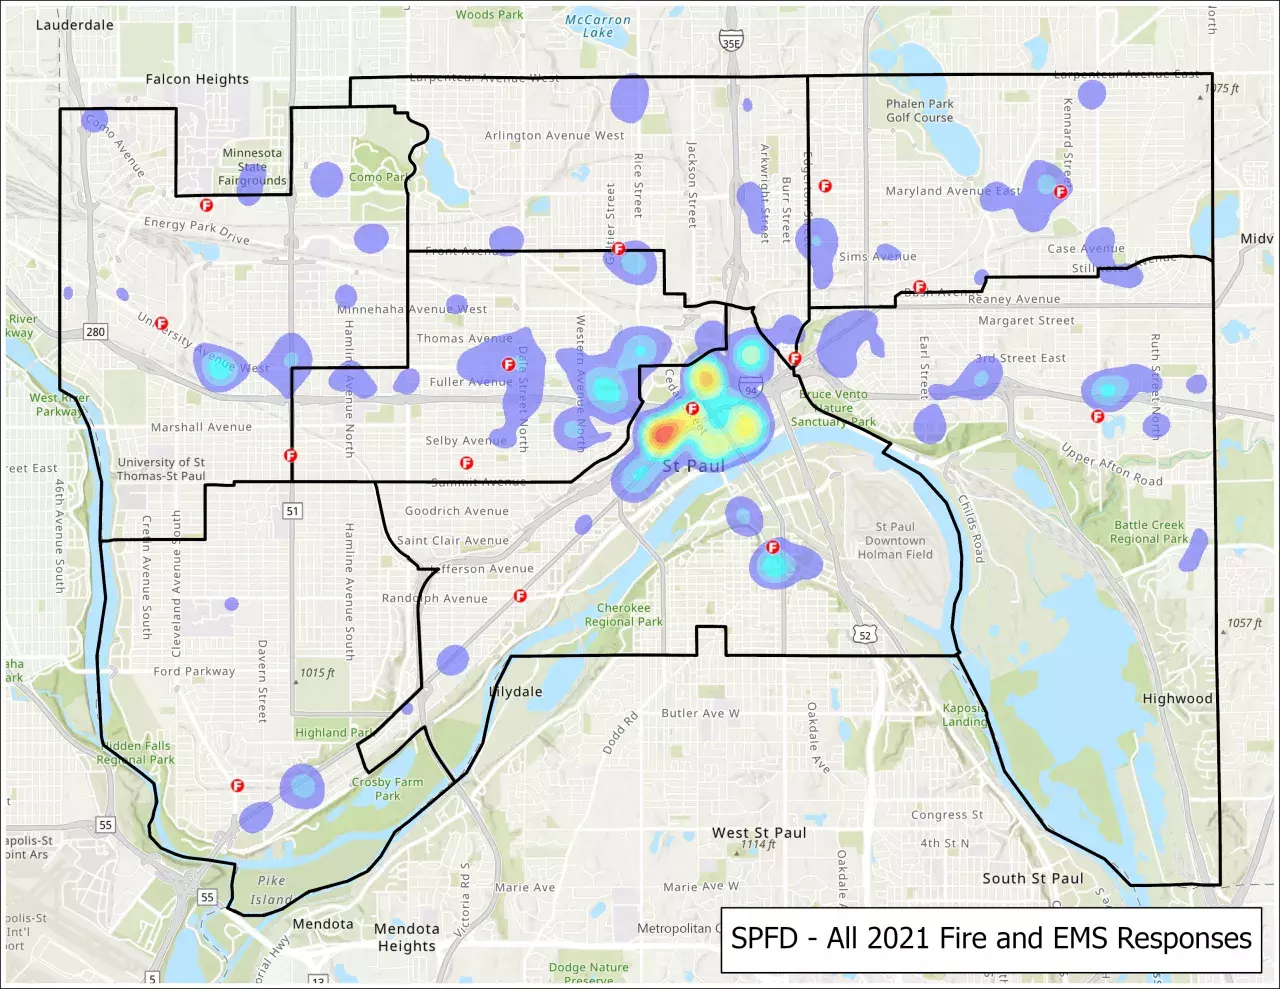
2021 HEAT MAP OF ALL SPFD FIRE & EMS RESPONSES
A heat map of all SPFD Fire and EMS Responses in Saint Paul